Difference between revisions of "Getting started with Yantrr Device Cloud"
From Yantrr Wiki
(→Overview) |
(→Getting Started) |
||
| Line 3: | Line 3: | ||
[[File:YDCOverview.png| left|thumb|400px | Overview of YDC ]] | [[File:YDCOverview.png| left|thumb|400px | Overview of YDC ]] | ||
| + | |||
| + | |||
= Getting Started = | = Getting Started = | ||
| Line 11: | Line 13: | ||
* Please click on the "Device Dashboard" tab to get started. | * Please click on the "Device Dashboard" tab to get started. | ||
| − | [[File: | + | = Devices List = |
| + | * Here a list of devices and there current status are displayed | ||
| + | * The Device ID generated for your registered device | ||
| + | The Device description entered at the time of registration | ||
| + | The current status of communication of the device with YDC | ||
| + | Last connected status | ||
| + | Mac ID of the device | ||
| + | Some supported operations on the device (Disabled for demo use) | ||
| + | * Click on the Device ID link to get to the dashboard | ||
| + | |||
| + | [[File:DeviceList.jpg| Devices List | left|300px|thumb]] | ||
| − | + | . To access individual device’s dashboard click on particular Device ID.For example, to access Dashboard of Device ID “ytr_0001” click on ytr_0001.[[File:NavigateDevDashboard.jpg| Access Individual Device Dashboard| center]]After clicking any particular Device ID, user will be redirected to its dashboard page like shown in below image.[[File:IndDevDashboard.jpg| Device Dashboard | center]]On this device dashboard page, user will get various sections which displays real time update coming from device like Device Information, status of Sensors and GPS, live sensors and GPS data, etc. To know all these sections detail go to “Sections on Device Dashboard Page”. | |
# '''Sections on Device Dashboard Page''' | # '''Sections on Device Dashboard Page''' | ||
## '''Device Information'''<br />This section displays the device details with its MAC ID, MIPS (CPU Frequency), Memory Information (RAM), Current CPU Temperature, Current CPU Load.[[File:DeviceInfo.jpg| Device Information| center]] | ## '''Device Information'''<br />This section displays the device details with its MAC ID, MIPS (CPU Frequency), Memory Information (RAM), Current CPU Temperature, Current CPU Load.[[File:DeviceInfo.jpg| Device Information| center]] | ||
Revision as of 21:45, 28 November 2015
Overview
Yantrr Device Cloud (YDC) is cloud based software that provides complete management and reporting for your registered Yantrr device. You can access features like Device status, positioning, control, and access its data from any browser.

Getting Started
- You will have to create a user account on the YDC, if you don't already have one. Click on the “Register Now” button, and fill in the required fields. An email with the verification link is sent and clicking on this completes your Registration process.
- Once logged in, please register your device(s) using the "Register New Device" link
- The Device dashboard, is the view where all the registered Yantrr devices like the VIBE or Beaglebone Black with Vayu Capes running YCM client will be displayed.
- If you are accessing the YDC demo site, the site will be presented in read only mode and the user can browse some of the Yantrr Demo Devices. Some of the functionality like Registering device and Admin tab will be disabled.
- Please click on the "Device Dashboard" tab to get started.
Devices List
- Here a list of devices and there current status are displayed
- The Device ID generated for your registered device
 The Device description entered at the time of registration
 The current status of communication of the device with YDC
 Last connected status
 Mac ID of the device
 Some supported operations on the device (Disabled for demo use)
- Click on the Device ID link to get to the dashboard
File:DeviceList.jpg
300px


- Sections on Device Dashboard Page
- Device Information
This section displays the device details with its MAC ID, MIPS (CPU Frequency), Memory Information (RAM), Current CPU Temperature, Current CPU Load.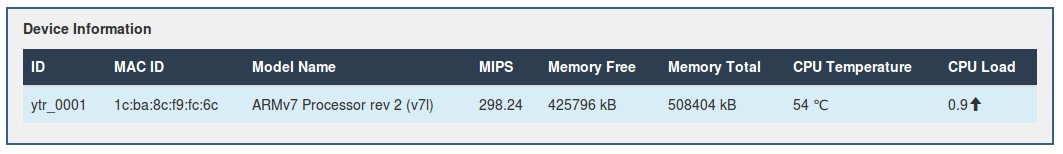
- Device Status and Control
This section displays the current status of Device, the Sensors attached to it as well as GPS. Also you can change the sample rate at which the data to be published to server from current device.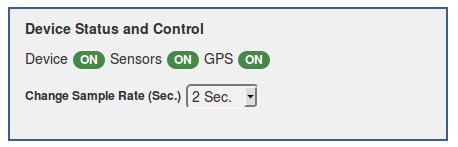
- Real Time Device GPS Location
This section displays the current location of device on map in real time. The current GPS location is displayed with timestamp in text format.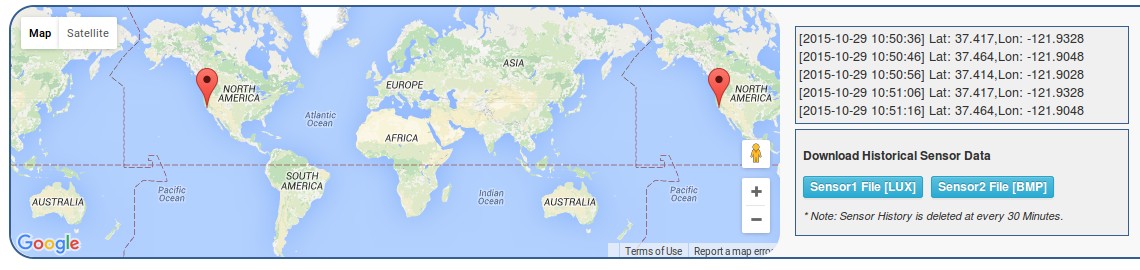
- Historical Device Data Access
This section gives capability to user such that he/she can download historical data of sensors attached to device. Currently the devices which are provided in this demo has LUX and BMP sensors attached to it.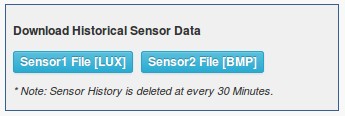
- Monitoring Device CPU Load and CPU Frequency
In this section the user can monitor the current CPU load and frequency of device. Also user can increase the CPU load or change CPU frequency.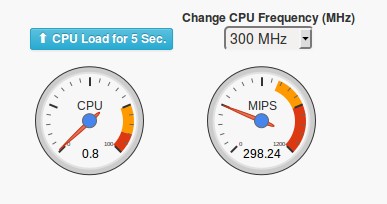
- Sample Weather Data from Device
This section displays the random sample weather data in real time.
- Real Time Sensor Data from Device
This section displays the sensor data in real time graphs.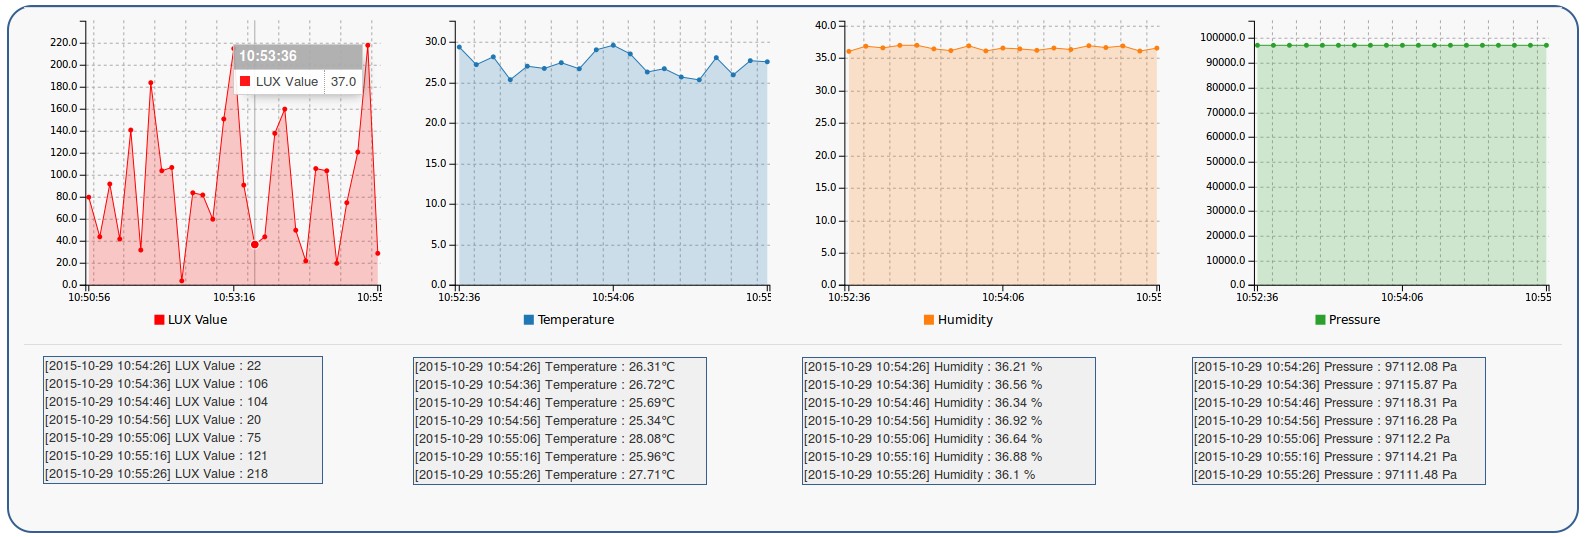
- Device Information
- Logout from YDC
For logout from current session, click on “Log Out” located in dropdown menu under current username.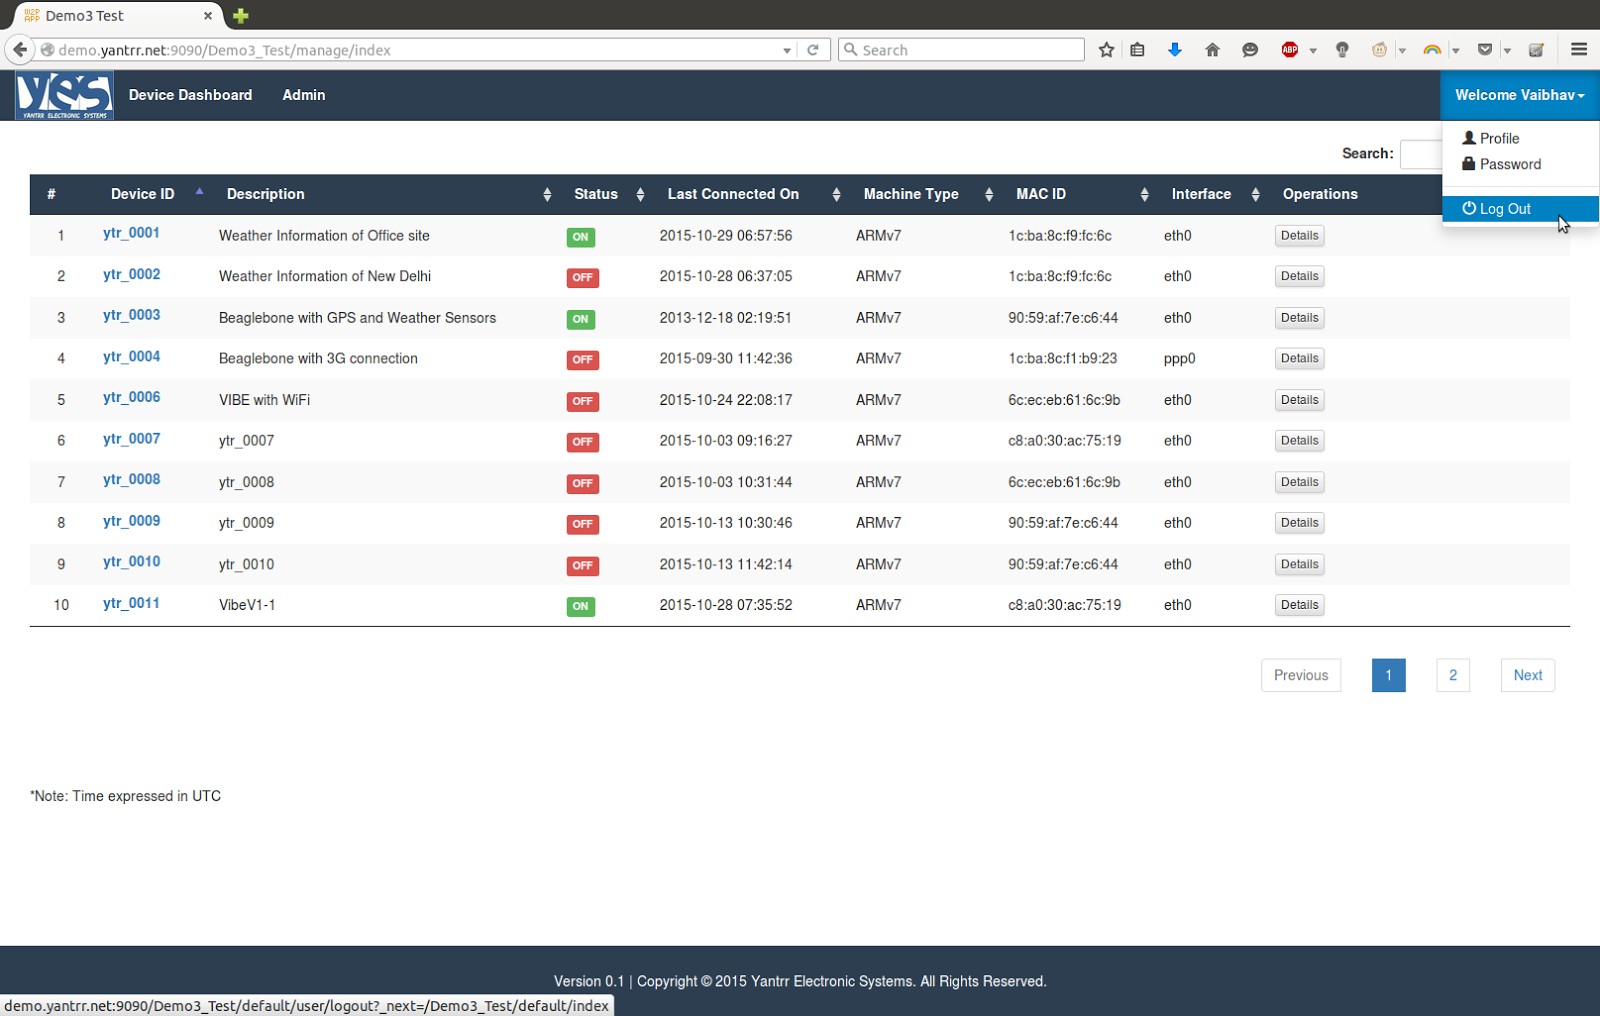


